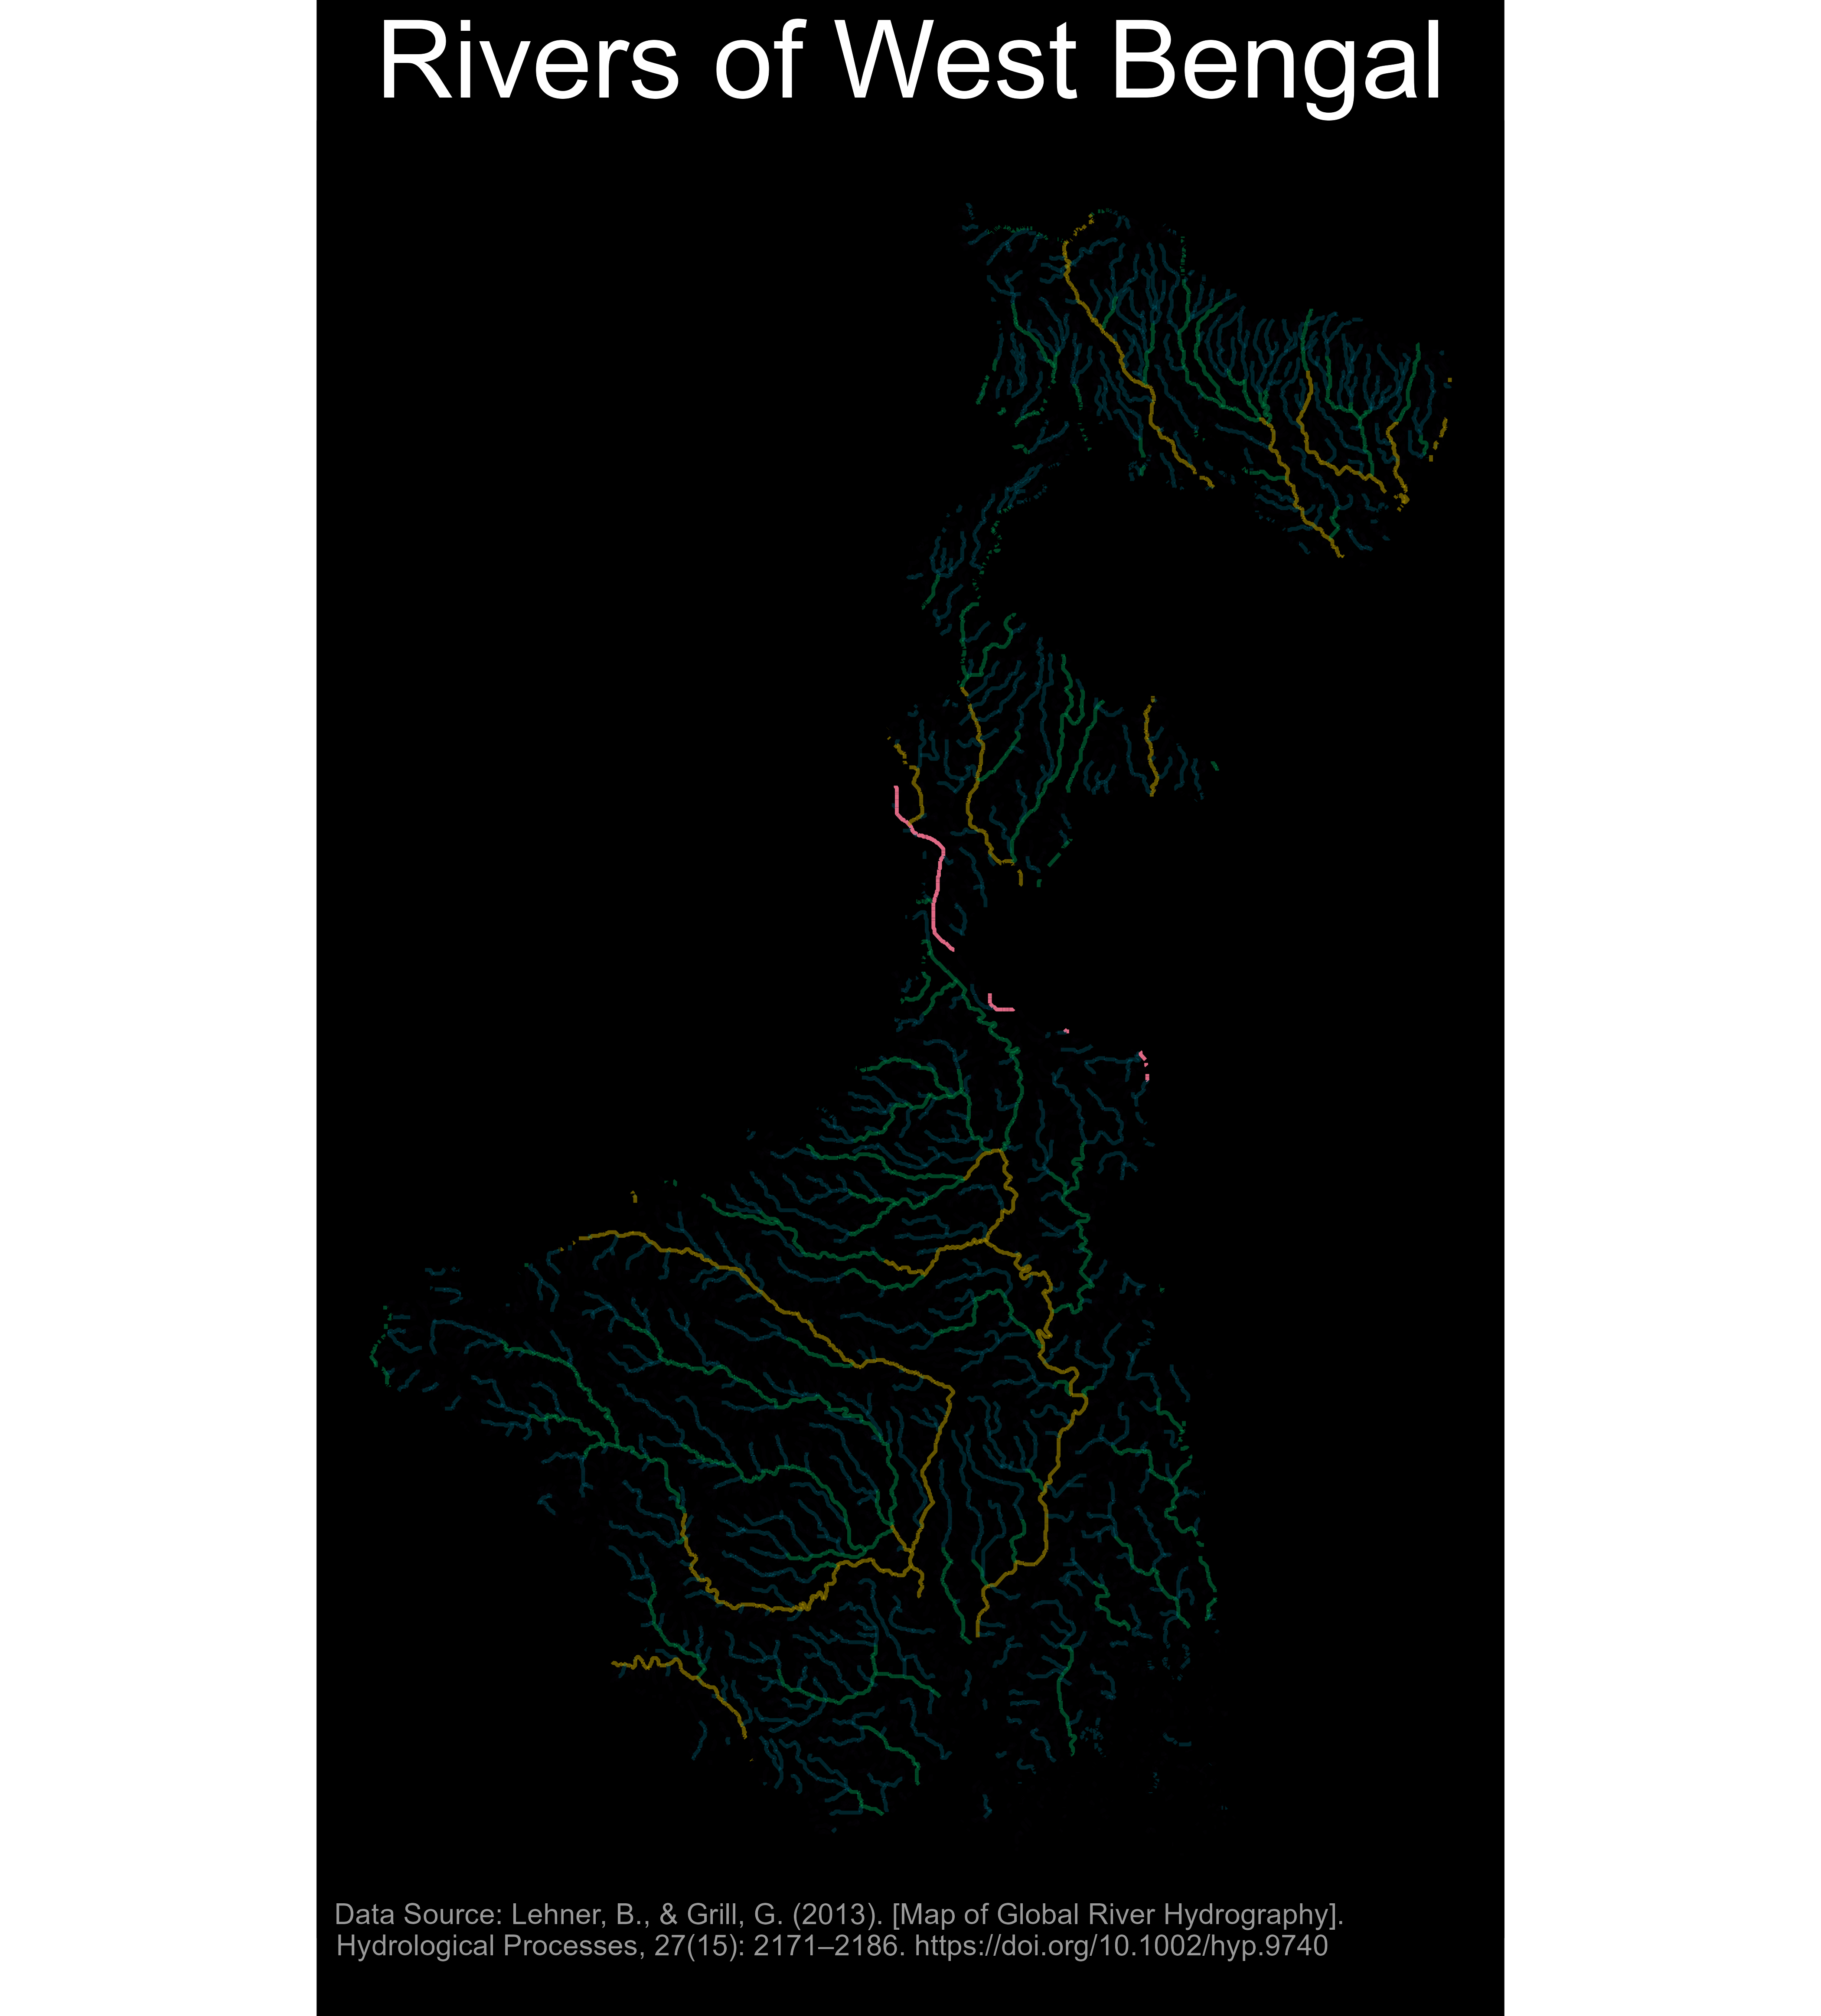
This project generates a visualization of the rivers in West Bengal, India, using geospatial data. The representation showcases the rivers with varying widths based on their order of flow, utilizing the ggplot2 library for rendering.
Data Sources
West Bengal Shapefile:
india-village-census-2001-WB.shpCitation: Village-Level Geospatial Socio-Economic Data for the state of West Bengal, India, 2001 [map]. No Scale Provided. Retrieved November 03, 2023, from Source
Asian Rivers Dataset (HydroSHEDS database):
HydroRIVERS_v10_as.shpCitation: Lehner, B., & Grill, G. (2013). [Map of Global River Hydrography]. Hydrological Processes, 27(15): 2171–2186. Source
Libraries used
heretidyverserasterggplot2sf
Workflow Description
- Library Loading:
- Loads the required libraries such as
here,tidyverse,raster,ggplot2, andsffor data handling and visualization.
- Loads the required libraries such as
- Shapefile Loading:
- Reads the West Bengal shapefile which contains the geographical boundaries of West Bengal, and selects only the geometry column for further use.
- Transforms the coordinate system of the West Bengal shapefile to EPSG:4326 (WGS 84) for consistency in geographical representation.
- River Data Loading:
- Reads the Asian Rivers dataset which contains the geometry and order of flow information of rivers.
- Selects only the
ORD_FLOWand geometry columns from the dataset for further use.
- Spatial Intersection:
- Performs a spatial intersection to filter out the rivers that are within the boundaries of West Bengal.
- River Width Rescaling:
- Rescales the
ORD_FLOWvalues to a new width variable, which is used to represent the width of rivers in the visualization. - Converts the
ORD_FLOWvariable to a factor variable for color mapping in the visualization.
- Rescales the
- Visualization Preparation:
- Creates a ggplot object with specified aesthetic mappings for color, size, and alpha (transparency) based on the order of flow of the rivers.
- Sets custom scales for color, size, and alpha to ensure a proper visual representation of river widths and order of flow.
- Applies a theme to the plot for a cleaner and more visually appealing appearance.
- Title and Citation:
- Adds a title to the plot to indicate the geographical focus (Rivers of West Bengal).
- Adds a caption to cite the data source of the river data.
- Saving the Plot:
- Saves the generated plot to a PNG file named
WestBengal_Rivers.pngwith specified dimensions and resolution.
- Saves the generated plot to a PNG file named
The script essentially loads necessary libraries and datasets, processes the geospatial data to filter and rescale river information, prepares and generates a visualization, and finally saves the visualization to a PNG file.
Code:
The code for this project can be found in the GitHub repository